By Antoinette Trujillo, BS, CST
In the Pikes Peak Community College Surgical Technology Program, student knowledge and curriculum comprehension are measured in a few ways. The one that has become a point of interest within our department is the way we analyze students’ computer-based quizzes taken in class at the end of each chapter.
Our learning management system, Desire 2 Learn (D2L), provides us with quiz statistics that can be accessed once the students have completed the exam. For those that utilize D2L, you can access these statistics by clicking on the quiz tab, then selecting the statistics you’d like to view on the drop-down under the desired quiz.

The Desire 2 Learn Brightspace Quiz tab.
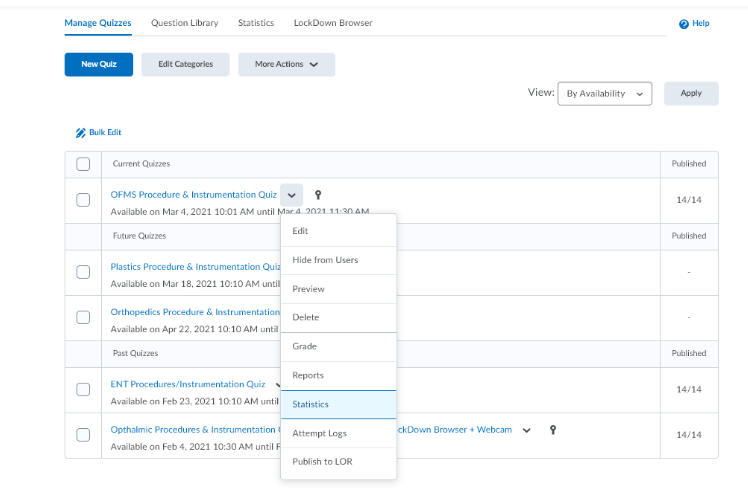
From the quizzes tab, each test has a drop-down caret with a new menu. Statistics are viewed from this menu.
Below is a breakdown of various quiz components/options we are currently analyzing.
User Statistics: We use this to see an individual student’s test grade compared to their peers’ and the class average. All three statistics are utilized to ensure that our students are on the right track.

An example of the user statistics view.
Question Statistics: This option is used to see how many students correctly or incorrectly answered each question. This statistic is extremely valuable, as it allows us to see commonly missed questions. Any question missed by a majority of students tells us that the topic was not adequately discussed or understood, and needs to be covered in more detail. These statistics also show if there were any questions that all students missed or answered correctly, in which case we may want to adjust the test for the future if it appears it was too hard or too easy.
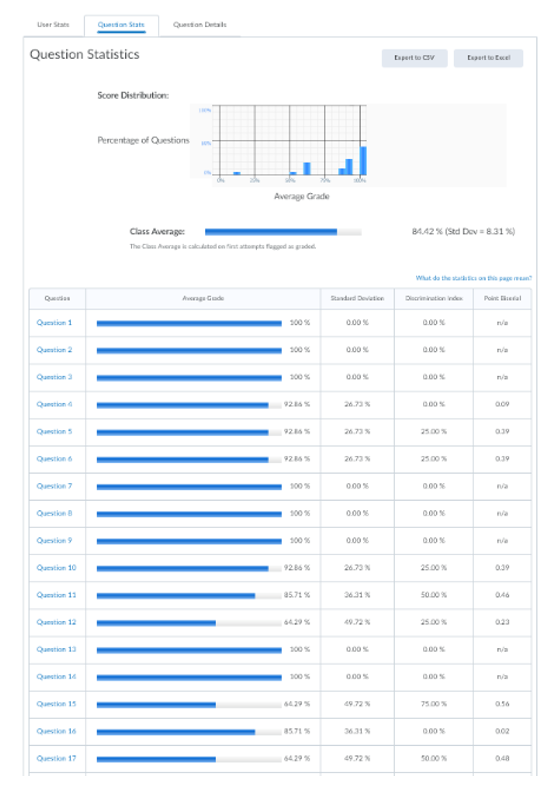
An example of the question statistics view.
Question Details: This component is used as the test is reviewed. We address why the incorrect answers would not be correct, as a general conversation with the students. Question details can be pulled up on our projectors and students can see that someone missed the question without revealing the person’s identity. If the student wishes, they can call themselves out for missing a question and explain why they selected the wrong answer, or they may ask for additional clarification in private.
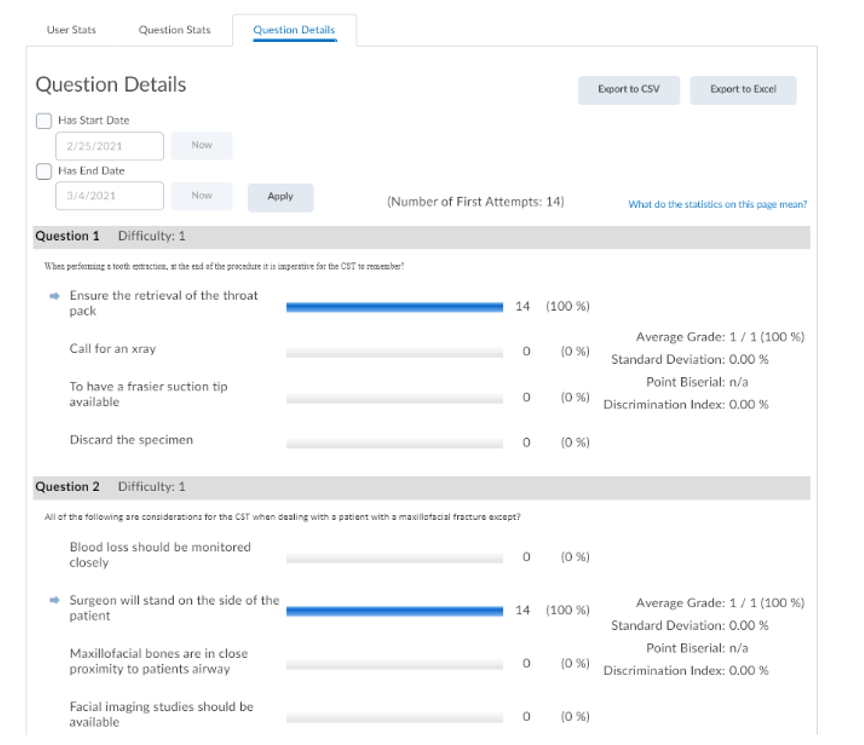
An example of the question details view.
Since incorporating these quiz statistics and tools into our program, we have ensured all students are on the same page and are comfortable with each chapter of content before we move on to the next lesson. The students have taken to these tools and appreciate our efforts to help them succeed in their education.
Note: Data analyzation is not exclusive to D2L. Many learning management systems allow for instructors to assess students’ progress to help them to succeed. If you are not familiar with how to access similar statistics within your learning management system, reach out to your institution’s LMS administrator or your LMS provider for platform-specific tutorials.
 Antoinette Trujillo, BS, CST, is a surgical technologist and surgical technology faculty/clinical coordinator for Pikes Peak Community College in Colorado Springs, Colorado. She holds her Associate of Applied Science in Surgical Technology and a Bachelor of Business Management with a certification in leadership. Trujillo is currently enrolled at Colorado State University – Pueblo for her master’s degree with a concentration in health care administration. She plans to complete the program in the summer of 2022.